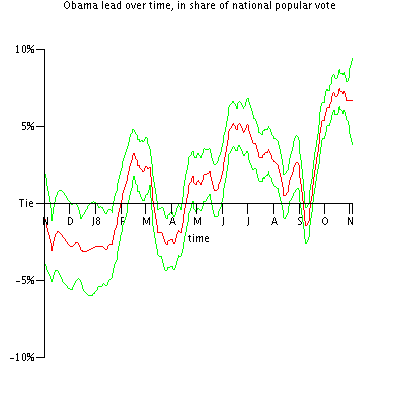
Obama by 3%
Popular vote estimate:
(Darker red means more votes for McCain, darker green for Obama.)
Prediction if the election were today
- Probability of electoral victory: over 99%.
- Expected value of electoral votes: 319.
- 95% range of electoral votes: 289 to 347.
- Probability of electoral college tie: .1%.
- Probability of popular victory: over 99%.
- Expected popular vote: Win by 3%.
- Swing states:
- PA 46%.
- OH 34%.
- Electoral vote distribution (electoral votes vs. probability):

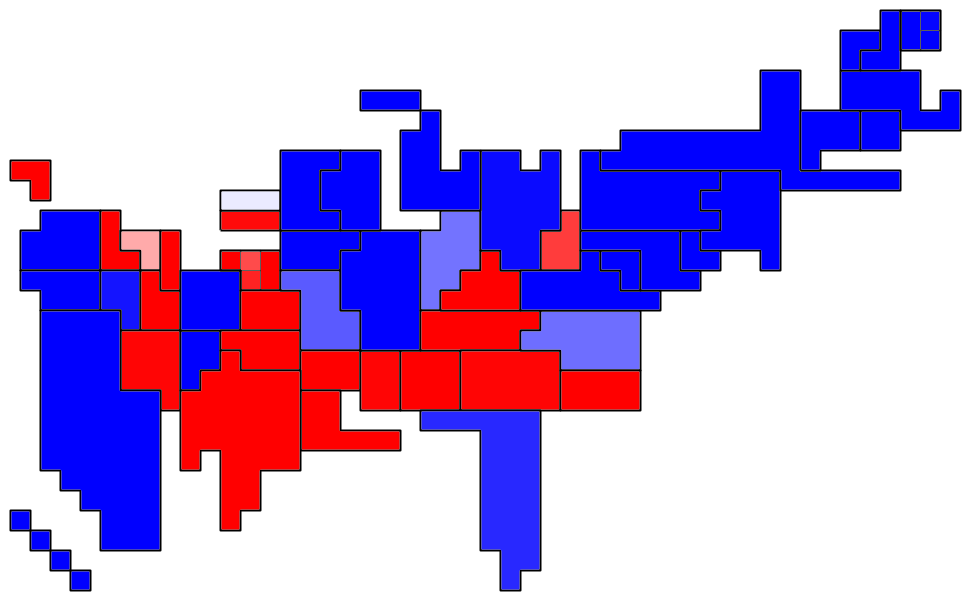
- Confidence map (states sized by electoral vote, darker red means higher confidence that McCain will win, darker green for Obama):

Prediction for Election Day
- Probability of electoral victory: 79%.
- Expected value of electoral votes: 309.
- 95% range of electoral votes: 189 to 405.
- Probability of electoral college tie: .6%.
- Probability of popular victory: 76%.
- Expected popular vote: Win by 3%.
- Swing states:
- OH 84%.
- PA 84%.
- MO 71%.
- NH 65%.
- NJ 61%.
- Electoral vote distribution (electoral votes vs. probability):

- Confidence map (states sized by electoral vote, darker red means higher confidence that McCain will win, darker green for Obama):

One extra thing: The Electoral College advantage
It's well known that in 2000, George Bush had an advantage from the Electoral College, winning a majority of electoral votes while failing to win a plurality of popular votes. By contrast, in 2004, John Kerry had an advantage from the Electoral College: With slightly more popular votes across the country, he would have won Ohio (and therefore the Electoral College) while losing the popular vote.
This year's election looks more like 2004. In my simulations, the two candidates have an equal chance of winning when McCain wins the popular vote by about 0.5%. The following chart shows election-day popular vote along the x-axis and probability of Obama victory on the y-axis.


0 Comments:
Post a Comment
<< Home