Election So Far

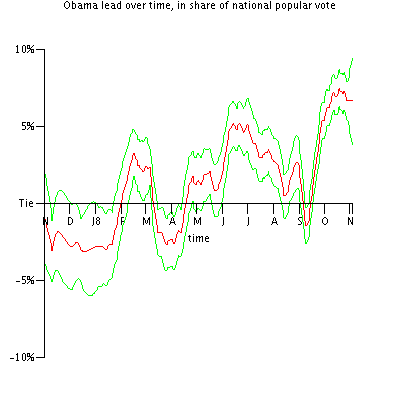
This chart shows my best estimate of what the Obama-McCain popular vote margin has been, is, and will be through the 2008 election, with 1.96Z confidence bands (commonly known as "margin of error"). The chart runs from 1 Nov 2007 to 2008 Election Day. (If anyone wants a chart that covers some other time period, let me know.)
Key dates:
Nov 7, 2006: 2006 general election
Feb 10, 2007: Obama announces 2008 candidacy
Apr 25, 2007: McCain announces 2008 candidacy
Jan 3, 2008: Iowa caucus
Feb 5, 2008: Super Tuesday
Mar 4, 2008: McCain clinches nomination
Mar 14 and 18, 2008: Wright story breaks; Obama gives a major speech in response
Jun 3, 2008: Obama clinches nomination
Jul 19-26, 2008: Obama takes international trip
Aug 23, 2008: Obama announces Biden
Aug 25-28, 2008: Democratic convention
Aug 29, 2008: McCain announces Palin
Sep 1-4, 2008: Republican convention
Sep 12-15, 2008: Lehman Brothers collapses
Sep 24, 2008: McCain suspends his campaign
Sep 26, 2008: Presidential debate in Oxford, MS (domestic policy)
Oct 2, 2008: Vice presidential debate in St. Louis, MO
Oct 7, 2008: Presidential debate in Nashville, TN (town hall)
Oct 15, 2008: Presidential debate in Hempstead, NY (foreign policy)
Nov 4, 2008: 2008 general election


5 Comments:
I don't understand the "Obama Lead Over Time" graph. What are the two green lines? Confidence bands, maybe?
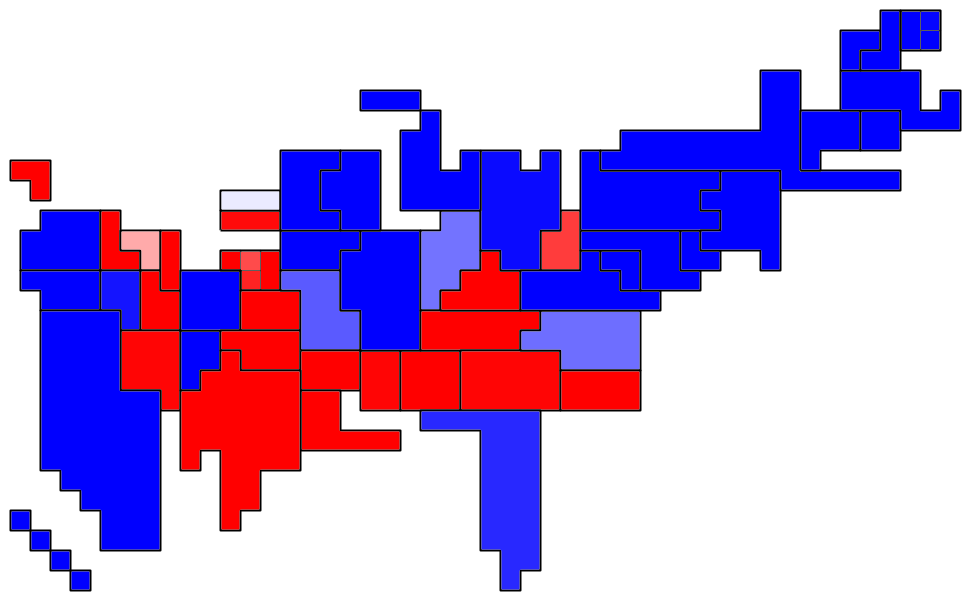
And two suggestions, purely for readability: First, label the x-axis in percentages. It would make it easier to read. Second, make that graph expandable in the same way as "Victory probability map."
It would be interesting if you posted a thorough explanation of your methodology, being as careful as you can to explain it in terms accessible to the non-specialist in statistics.
Yep, they're confidence bands. At each point in time on the graph, I have 95% confidence that popular opinion was or is or will be between the two green lines. The colors are completely arbitrary.
I think you mean that I should label the y-axis in percentages, which I'd love to do, but can't with the program I'm---
Wait, I think I just figured out how to label it as percentages.
(The x-axis represents time, from election day of 2006 to election day of 2008.)
I wrote up the methodology a while back, but I think it's completely unreadable, and I'm not sure if it's even still available. I'm going to try writing it again tomorrow.
Obama announced his candidacy on Feb 10th, 2007, not the 20th as you have here.
Wny 1.96Z? 95% confidence is more like 1.64Z If you are going to blind folks with your statistical brilliance, you should at least use the right values to make it convincing.
To the know-it-all anonymous of 11/3:
You're confused between one-tailed and two-tailed confidence. When you read somewhere that "95% confidence is 1.64Z," that meant that 95% of the normal distribution is between -infinity and +1.64 standard deviations.
By contrast, when I say that I have 95% confidence that popular opinion is between the +/- 1.96Z lines, I mean quite literally that 95% of the normal distribution is between -1.96 and +1.96 standard deviations.
Post a Comment
<< Home