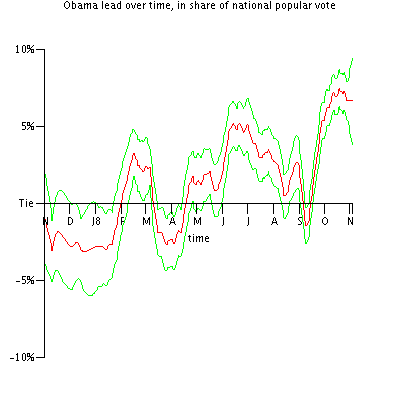
Victory probability mapObama lead over time

Saturday, May 31, 2008

Measures of Swinginess

There are many reasonable ways to measure how much of a swing state a state is. I want to describe the two methods that I use on this site, as well as the method that FiveThirtyEight.com uses, and what I think the pluses and minuses of each are.

Swinginess Method 1: Correlation to electoral college results. Whether Obama wins a state is a random variable, whether Obama wins the electoral college is another random variable, and these two random variables have some correlation. Definitionally, states that are better indicators of the national results will have a higher correlation.

Advantages of Method 1 (correlation). This measure is easy to calculate, and may be useful on Election Night to know which states' results to focus on during the early part of the evening.

Disadvantage of Method 1 (correlation). This method fails to make it clear how much more important a large state is than a small state. For example, suppose that simulations in advance of the 2000 election showed 1) that Bush would clearly win all the states he ultimately won, except FL, for 246 electoral votes; 2) that Gore would clearly win all the states he ultimately won, except NM, for 261 electoral votes; and 3) that NM and FL would both have 50/50 chances to go either way. In this scenario, the only state that matters is FL with its 25 electoral votes; NM's 5 votes wouldn't matter at all. Under the correlation measure, the FL results would have 100% correlation with the electoral results, but the NM results would also have very high (probably 90%+) correlation with the electoral results because opinion changes in the two states are highly correlated. This measure of swinginess would clearly be ludicrous in this situation, since FL is the only state that matters.

The Banzhaf Index. The Banzhaf Index attempts to measure the power of a voting bloc in an election. In the context of the electoral college, it is defined as the probability of a state's results changing the outcome of the election, assuming that each candidate has a 50% probability of winning each state, and that state results are uncorrelated. See the Wikipedia page cited above for more details.

The Shapley-Shubik Index. The Shapley-Shubik Index also attempts to measure the power of a voting bloc in an election. It gives equal weight to all possible sequences in which states may join a winning coalition, and measures how often a given state is the one that put the coalition over the edge. See the Wikipedia page cited above for more details.

Disadvantage of using a power index. The obvious disadvantage of these two indices is that they don't take into account that states aren't equally likely to vote either way, and that all the possible winning combinations are unequally likely to happen. They end up indicating that the largest states -- CA, TX, and NY -- are the most important, even though we all know that they are all safe states. These power indices are useful for some purposes, but not for discovering what the swing states are.

Swinginess Method 2a (naive pseudo-Banzhaf). Like the Banzhaf Index, this measures a probability that a state's results will matter the outcome of the election, but without the Banzhaf Index's inapt assumptions about the state results. Instead, run the election simulations, and give each state 1 point each time it is in the winning coalition and necessary to the coalition; 0 points each time it is in the losing coalition; and 0 points each time it is in the winning coalition but unnecessary to the coalition. Then after running 10,000 simulations or so, I divide each state's number of point by the number of simulations.

Disadvantage of Method 2a. This gives too much weight to large states that one candidate will clearly win. For example, CA gets full credit as a "swing state" whenever Obama wins a simulation by under 110 votes. Clearly this is wrong since Obama will win CA in any close national election. A better method will take into account that Obama is ahead by a lot in CA, but only by a little bit in PA.

Swinginess Method 2b (pseudo-Banzhaf). The solution to the problem with Method 2a is to give a state more credit for swinginess when its results are very close in a simulation -- intuitively, FL should get more credit than TX for swinginess in the 2000 election even though the loss of either state would have swung the electoral college for Bush, since FL had a very close election and TX did not. In this sort of situation, FL should get very close to 1 point, and TX should get very close to 0 points. The formula I use to assign points to relevant states is 2*NormalCDF((0.5-SimulVote)/EstVol) for a state in the winning coalition with enough electoral votes to be necessary to the coalition, 0 for a state in the winning coalition that is unnecessary to the coalition, and 0 for a state in the losing coalition. Here NormalCDF is the cumulative distribution function of the standard normal distribution, SimulVote is the state's result in the simulation, and EstVol is 1 standard deviation of uncertainty in my forecast for that state.

Swinginess Method 3 (pseudo-Shapley-Shubik). This is the solution that fivethirtyeight.com uses, and you can read a description at that website. (I would calculate it from my simulations too, but my poor coding makes this a hard thing to implement.) The key difference between this method and the Shapley-Shubik Index is that Shapley-Shubik orders the states randomly, while Method 3 orders them from the most pro-McCain state to the most pro-Obama.

The critical question: What is a "swing state"? Before continuing to read this, go look at the results of the 1984 election, and decide what states you think should count as "swing states." Thinks this through, and then scroll down to see what I think the two reasonable answers are.


One possible answer is, "There are no 'swing states' because no individual state is so important in such a blowout." Another possible answer is, "States like MI, MO, and GA were 'swing states'; because if the nation as a whole had moved uniformly towards Mondale so that the election became close to even, then those states would have been the ones to make a difference." There's no clear "right answer" here. I think I prefer the first for analyzing a particular election, but the second for analyzing the general political milieu. That is, if I were concerned with the 1984 election specifically, then I think the right answer is that there were no swing states; but if I were concerned with which states occupied the political center in the mid-80s, then I think the right answer is that MI, MO, GA, etc. did.

The critical advantage/disadvantage of Methods 2b and 3, depending on your perspective. The pseudo-Banzhaf index uses the first interpretation of what a swing state is, and the pseudo-Shapley index uses the second interpretation. If you measured these on simulations just before the 1984 election, you would find that each state had a pseudo-Banzhaf index of ≈0, but that MI, MO, GA, etc. had significant pseudo-Shapley index scores.

I hope that explanation was clear enough. If it's not, ask questions in the comments and I'll try to do better.


Read more (maybe)!
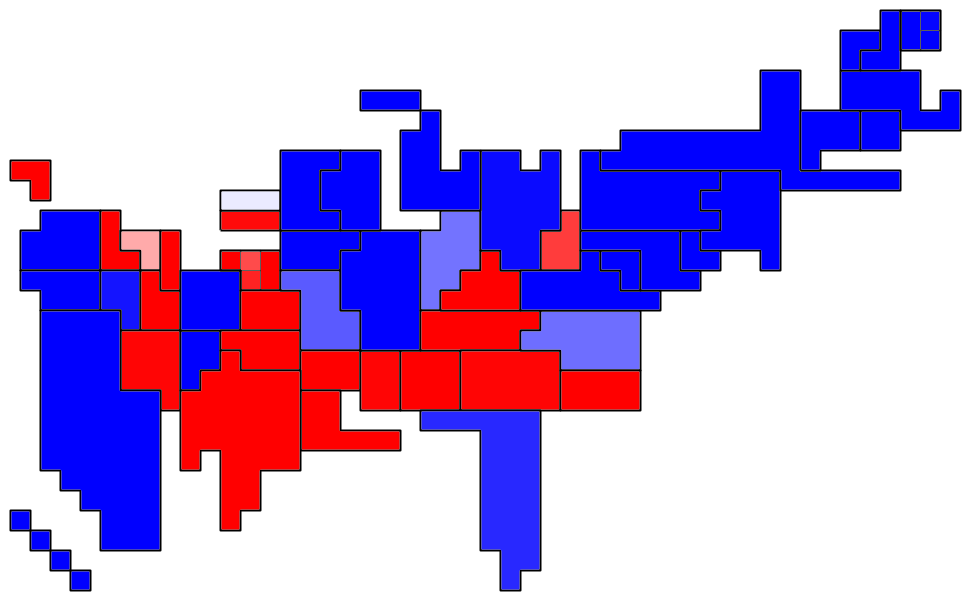
Obama up by 0.8%; 66% chance of victory

Prediction for Election Day

  • Probability of victory: 66% electoral, 60% popular. This includes 3% chance of tie.
  • Expected value of vote: 279 electoral votes, popular win by 0.8%.
  • 95% range of electoral votes: 189 to 354.
  • Swing states (correlation):
    • PA 88%
    • OH 71%
    • NH 65%
    • MI 59%
    • NV 57%
    • NM 57%
    • CO 51%
    • MO 45%
    • NJ 44%
    • WI 42%
  • Swing states (pseudo-Banzhaf):
    • PA .103
    • OH .033
    • NM .031
    • MI .030
    • CO .022
    • NV .017
  • Confidence map (states sized by electoral vote, darker red means higher confidence that McCain will win, darker green for Obama): Map showing my confidence in who the leader will be.

Prediction if the election were today

  • Probability of victory: 90% electoral, 79% popular. This includes a 6% chance of a tie.
  • Expected value of vote: 284 electoral votes, popular win by 0.8%.
  • 95% range of electoral votes: 248 to 309.
  • Swing states (correlation):
    • PA 83%
  • Swing states (pseudo-Banzhaf):
    • PA .132
    • NM .036
    • MI .035
    • CO .024
    • OH .021
    • NV .016
  • Confidence map (states sized by electoral vote, darker red means higher confidence that McCain will win, darker green for Obama): Map showing my confidence in who the leader is.

Popular vote estimate:

(Darker red means more votes for McCain, darker green for Obama.) Map showing my estimate of the popular vote on 5/17
Read more (maybe)!

Election So Far

This chart shows my best estimate of what the Obama-McCain popular vote margin has been, is, and will be through the 2008 election, with 1.96Z confidence bands (commonly known as "margin of error"). The chart runs from 1 Nov 2007 to 2008 Election Day. (If anyone wants a chart that covers some other time period, let me know.)

Key dates:
Nov 7, 2006: 2006 general election
Feb 10, 2007: Obama announces 2008 candidacy
Apr 25, 2007: McCain announces 2008 candidacy
Jan 3, 2008: Iowa caucus
Feb 5, 2008: Super Tuesday
Mar 4, 2008: McCain clinches nomination
Mar 14 and 18, 2008: Wright story breaks; Obama gives a major speech in response
Jun 3, 2008: Obama clinches nomination
Jul 19-26, 2008: Obama takes international trip
Aug 23, 2008: Obama announces Biden
Aug 25-28, 2008: Democratic convention
Aug 29, 2008: McCain announces Palin
Sep 1-4, 2008: Republican convention
Sep 12-15, 2008: Lehman Brothers collapses
Sep 24, 2008: McCain suspends his campaign
Sep 26, 2008: Presidential debate in Oxford, MS (domestic policy)
Oct 2, 2008: Vice presidential debate in St. Louis, MO
Oct 7, 2008: Presidential debate in Nashville, TN (town hall)
Oct 15, 2008: Presidential debate in Hempstead, NY (foreign policy)
Nov 4, 2008: 2008 general election


Read more (maybe)!

Saturday, May 24, 2008

Obama by 1.6%

Commentary

I've added another measure of swinginess below. The old measure is simply the correlation of a state's results to the results of the electoral college. I call the new measure a "pseudo-Banzhaf index" because it bears some relation to the Banzhaf Index. I'll explain what it is in another post this weekend, and I'll give my thoughts on the relative merits of these swinginess measure and the measure that Poblano at his excellent website.

Popular vote estimate:

(Darker red means more votes for McCain, darker green for Obama.) Map showing my estimate of the popular vote on 5/17

Prediction if the election were today

  • Probability of electoral victory: 98%.
  • Expected value of electoral votes: 295.
  • 95% range of electoral votes: 269 to 309.
  • Probability of electoral college tie: 2%.
  • Probability of popular victory: 97%.
  • Expected popular vote: Win by 1.6%.
  • Swing states (correlation with electoral college result):
    • PA 80%
  • Swing states (pseudo-Banzhaf rating):
    • PA .10
    • MI .02
    • NM, CO, NJ .01
  • Electoral vote distribution (electoral votes vs. probability): Electoral vote probability chart
  • Confidence map (states sized by electoral vote, darker red means higher confidence that McCain will win, darker green for Obama): Map showing my confidence in who the leader is.

Prediction for Election Day

  • Probability of electoral victory: 74%.
  • Expected value of electoral votes: 290.
  • 95% range of electoral votes: 194 to 364.
  • Probability of electoral college tie: 3%.
  • Probability of popular victory: 69%.
  • Expected popular vote: Win by 1.6%.
  • Swing states (correlation):
    • PA 89%
    • OH 72%
    • NH 66%
    • NV 58%
    • NM 57%
    • MI 53%
    • CO 50%
    • MO 46%
    • NJ 46%
    • WI 40%
  • Swing states (pseudo-Banzhaf):
    • PA .12
    • OH .04
    • MI, NM .03
    • CO .02
    • NJ, NV, WI .01
  • Electoral vote distribution (electoral votes vs. probability): Electoral vote probability chart
  • Confidence map (states sized by electoral vote, darker red means higher confidence that McCain will win, darker green for Obama): Map showing my confidence in who the leader will be.

Read more (maybe)!

Sunday, May 18, 2008

Obama by 0.9%

Popular vote estimate:

(Darker red means more votes for McCain, darker green for Obama.) Map showing my estimate of the popular vote on 5/17

Prediction if the election were today

  • Probability of electoral victory: 85%.
  • Expected value of electoral votes: 283.
  • 95% range of electoral votes: 248 to 309.
  • Probability of electoral college tie: 3%.
  • Probability of popular victory: 84%.
  • Expected popular vote: Win by 0.9%.
  • Swing states:
    • PA 88%.
    • OH 40%.
  • Electoral vote distribution (electoral votes vs. probability): Electoral vote probability chart
  • Confidence map (states sized by electoral vote, darker red means higher confidence that McCain will win, darker green for Obama): Map showing my confidence in who the leader is.

Prediction for Election Day

  • Probability of electoral victory: 63%.
  • Expected value of electoral votes: 278.
  • 95% range of electoral votes: 185 to 355.
  • Probability of electoral college tie: 2%.
  • Probability of popular victory: 62%.
  • Expected popular vote: Win by 0.9%.
  • Swing states:
    • PA 92%.
    • OH 74%.
    • NH 66%.
    • CO 56%.
    • NV 56%.
    • MI 54%.
    • NM 50%.
    • MO 49%.
    • NJ 46%.
    • WI 43%.
  • Electoral vote distribution (electoral votes vs. probability): Electoral vote probability chart
  • Confidence map (states sized by electoral vote, darker red means higher confidence that McCain will win, darker green for Obama): Map showing my confidence in who the leader will be.

Read more (maybe)!

Saturday, May 17, 2008

Florida -- not so darn important

Note to Clinton supporters. Stop extrapolating your experience with Florida in 2000 into the 2008 -- Florida is not a key state this time. Kerry didn't need FL; he needed OH, and anything further would have been sugar on top of the electoral victory. Clinton's map looks a lot like Kerry's, so the situation is the same: She would need, and probably could get, Kerry's states plus OH, and anything else including FL would be superfluous. Obama's map is more flexible, but it also doesn't rely on FL; he wins with the Kerry states plus EITHER Ohio OR a majority of IA, MO, CO, NM, and NV, and anything else is superfluous.

I just noted how FL was not an important state in 2004 and is not in 2008. In addition to that, other than in 2000, FL has not historically been a must-win state for Democrats since the Civil Rights Era except maybe in 1976 for Carter (a conservative southerner with a much much different base of states than either Clinton or Obama).

So Hillary people, stop fretting about FL so much. Whether Obama wins has little to do with whether FL wants to come along for the ride.

Just to be clear, although there is some ill-informed stuff (FL's importance) and downright ludicrous stuff (WV's importance) coming out of the Clinton camp, I do agree that MI, PA, and OH are important states for Obama, though OH is not as important for him as it is for Clinton. Given that Obama is probably slightly weaker than Clinton in those three states and maybe MO and VA, but stronger in WI, IA, CO, NM, and NV, I don't agree that Clinton is clearly the more electable candidate, particularly now that the Wright nonsense has blown over. Nor would I assert that Obama is clearly the more electable candidate. They both have great chances against McCain.

Labels:


Read more (maybe)!

Electoral College ties

As I've mentioned before, I believe an Electoral College tie is possible, and that Obama will win if it occurs. The three main situations that would produce a tie all start with a baseline of Obama winning the intersection of the Gore and Kerry states (includes Pacific states ex AK; Great Lakes states ex IN and OH; and the Northeast from ME to DC ex NH):

  1. Obama also wins IA, CO, and NM;
  2. Obama also wins IA, CO, and NV;
  3. Obama also wins NH, IA, NM, and NV.

There are also some less plausible scenarios in which Obama loses PA but wins OH, but I believe that it is unlikely for Obama to win OH while losing PA. Overall, the probability of a tie seems to be in the neighborhood of 1-2%.

Recall that in the event of a tie, the House of Representatives chooses the President from among the top Electoral vote-getters, with each state delegation having one vote. It takes 26 states to elect the president. If neither candidate gets 26 states, they keep balloting. If the House can't decide, then the VP (chosen by the Democratic Senate) acts as President.

The good news for Democrats is that, with the election of Democrat Travis Childers to the House from Mississippi, Democrats now control an even greater majority of state delegations: 27-21 with two delegations tied. Up until the Childers victory, it would only have taken the loss of one delegation to take the election away from Obama; now it would take two.

I see two risks. One is that Obama loses a state with a majority Democratic delegation, and then Democratic House members (particularly Southern and Appalachian Blue Dogs) from that state vote for McCain. The other is that Democrats lose states in the November election.

Here are the states vulnerable to representatives being unfaithful because of McCain winning their states. I've put asterisks next to the ones of particular concern.

  • *AR: 3-1 Democratic, Obama loses, 2 Blue Dogs.
  • CO: 4-3 Democratic, Obama loses in 1 of the 3 main tie scenarios and loses Salazar's district in all scenarios, 1 Blue Dog.
  • *IN: 5-4 Democratic, Obama loses, 3 Blue Dogs.
  • MN: 5-3 Democratic, Obama wins the state but loses Peterson's district.
  • *MS: 3-1 Democratic, Obama loses, 2 Blue Dogs.
  • NH: 2-0 Democratic, Obama loses in 2 of the 3 main tie scenarios.
  • *NC: 7-6 Democratic, Obama loses, 2 Blue Dogs.
  • ND: 1-0 Democratic, Obama loses, 1 Blue Dog.
  • SD: 1-0 Democratic, Obama loses, 1 Blue Dog.
  • *TN: 5-4 Democratic, Obama loses, 4 Blue Dogs.
  • *WV: 2-1 Democratic, Obama loses.

And here are the ones vulnerable to Democratic losses:

  • *IN: 5-4 Democratic, Hill is in a re-re-rematch.
  • IA: 3-2 Democratic, Boswell always seems to be vulnerable.
  • MN: 5-3 Democratic, Walz may have a challenging race. On the other hand, Democrats might pick up Ramstad's seat.
  • *MS: 3-1 Democratic, Childers will presumably be in another close race.
  • *NC: 7-6 Democratic, does Shuler have a decent challenger?
  • PA: 11-8 Democratic, Carney, Patrick Murphy, and Altmire are all vulnerable to various extents.
  • WI: 5-3 Democratic, does Kagen have a decent challenger?

On the other hand, the Republicans only have to be concerned about:

  • *DE: 1-0 Republican, Obama wins.
  • MI: 9-6 Republican, but Walberg has a good challenger and Obama will win the state.
  • NV: 2-1 Republican, Obama wins in 2 of 3 scenarios.
  • *NM: 2-1 Republican, but all three seats are open, and Obama wins in 2 of 3 scenarios.
  • WY: 1-0 Republican, but I assume Cubin is vulnerable as always.

Given that 1) the Republicans will probably not be able to get a 26-state majority of their own even with a few Democratic switchers; and 2) the Democratic Senate will be able to install a Democratic acting President if the House fails to choose a President, I would think that Democrats like Gene Taylor and Heath Shuler would not choose to throw the election into chaos by voting for McCain. Nevertheless, we shouldn't underestimate how tough and dirty the Republicans could fight, nor how weak some Democrats can be, particularly if McCain wins the popular vote. Hopefully, Congressional Democrats will make it clear that this is expected to be a strictly party-line vote, akin to choosing the Speaker.

Labels: ,


Read more (maybe)!